PUE is money: the real economics of cooling choices
PUE 1.45 versus 1.06 sounds like a rounding error until you multiply by 8,760 hours. On one megawatt of IT load, the gap between air and immersion cooling is a quarter-million dollars a year — before you count the throughput.
Power Usage Effectiveness is the most consequential number most compute buyers never ask about. It is simply total facility power divided by IT power: a PUE of 1.50 means that for every watt reaching a GPU, another half-watt goes to cooling, power conversion, and lights. That overhead watt is billed at the same rate, every hour, all year.
The arithmetic, in the open
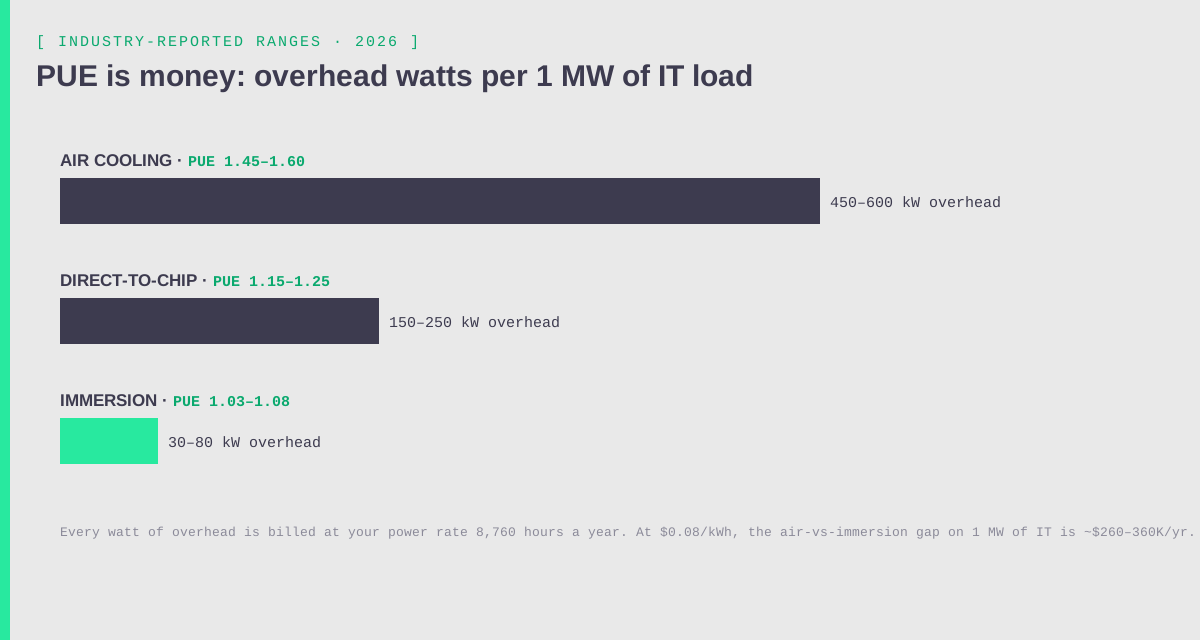
Take one megawatt of IT load and 2026 industry-reported PUE ranges: air at 1.45–1.60 means 450–600 kW of overhead; direct-to-chip at 1.15–1.25 means 150–250 kW; immersion at 1.03–1.08 means 30–80 kW. At Oklahoma’s ~$0.08/kWh, the air-versus-immersion gap of roughly 370–520 kW is worth about $260–360K per year, per IT-megawatt. At a coastal colo paying $0.20/kWh, the same gap costs $650–910K. This is our own calculation from published ranges — check it with your own rates; the spreadsheet is one line long.
Third-party TCO work reaches the same shape: one 2026 analysis of a 64-rack AI deployment put ten-year total cost at roughly $28M for immersion versus $42M for air — a $14M spread driven by the PUE difference plus 60–75% less real estate. And the second-order effect compounds it: cooler chips do not throttle, so the same hardware ships more tokens per dollar.
Why our number starts lower
The other factor in the bill is the rate itself. PUE multiplies your power price — which is why we put the site in Mead, Oklahoma at roughly $0.08/kWh with an owned 3 MVA transformer, and why z1power LFP batteries behind the meter handle peaks instead of demand charges. A modest PUE at a cheap rate beats a heroic PUE at a coastal one: at 110 kW of Phase-1 IT load, every 0.1 of PUE we avoid is worth about $7,700 a year — and the same discipline scales with Buildings 2 and 3.
What is your measured (not design) PUE? What power rate is baked into my $/GPU-hour? Do you throttle under thermal load, and will you show me sustained-throughput data in August? Providers with good answers volunteer them.
Industry-reported 2026 ranges: legacy air-cooled facilities run 1.45–1.60, modern direct-to-chip liquid designs achieve roughly 1.15–1.25, and immersion systems report 1.03–1.08. Purpose-built AI campuses in markets like South Korea are targeting under 1.2 as standard.
Overhead scales with IT load, PUE, and power rate: on 1 MW of IT at $0.08/kWh, moving from air (PUE ~1.5) to immersion (~1.06) saves roughly $260–360K per year; at $0.20/kWh the same move saves $650–910K. Multiply your own IT kW × (PUE gap) × your rate × 8,760 hours.
Usually, because the provider’s largest operating cost is power and cooling overhead. But the power rate matters as much as the ratio: a PUE of 1.3 at $0.08/kWh produces cheaper GPU-hours than a PUE of 1.1 at $0.25/kWh. Ask providers for both numbers.
Phase 1A at Mead uses engineered air with hot/cold-aisle containment at ~114 kW IT load, with the bigger lever being Oklahoma power at ~$0.08/kWh and behind-the-meter z1power batteries. As-built PUE will be published at power-on rather than promised in advance — measured beats marketed.